Digital Marketing - Rejection Analytics
What is it used for (purpose)?
- Digital Marketing contains a Rejection Analytics dashboard which provides high-level visibility into rejection counts, rejection rates, and top rejection reasons to enable data-driven quality improvement.
What is on this page?
- Filters (left-hand pane)
- Filter By Analytics
- Filter By Leads
Navigation (How do I get to Digital Marketing?)
There are two ways to navigate to this page:
In the Home page
- Click ‘Digital Marketing’ on the Frequently Used Apps or Available Apps
- By default, you will be taken to the Home Page. The Rejection Analytics card is visible. If clicked, you are taken to the Analytics page where you will see menu items to the far left:
- Analytics
- Leads
Using the Navigation bar.
- Click ‘Apps’ button on the top right corner of the Navigation bar, and see all available apps
- Click on the ‘Digital Marketing’ App
- By default, you will be taken to the Home Page, The Rejection Analytics card is visible. If clicked, you are taken to the Analytics page where you will see menu items to the far left:
- Analytics
- Leads
Purpose
Publishers submit leads for multiple campaigns throughout a quarter. Leads are validated using automated validation or manual review.
When leads are rejected, publishers currently receive individual email notifications for each rejection.
This self-service dashboard shows publishers all their rejected leads across campaigns with summary metrics, time period filtering, and campaign selection.
The dashboard provides high-level visibility into rejection counts, rejection rates, and top rejection reasons to enable data-driven quality improvement.
Filtered data can be exported.
Publishers see only their own campaign data, while media buyers see aggregated data across all publishers they manage.
Access is permission based.
How to use / Interpret
Digital Marketing has 2 sub menus:
- Rejection Analytics
- Rejected Leads
Rejection Analytics is comprised of:
- Filters
- Returned counts & rejection rate
- Compare to previous period function (based on date range)
- Total Leads chart representing returned counts for accepted and rejected leads by:
- Volume (stacked columns)
- Rate % (trend line)
- Both
- Total Leads chart can be broken down by:
- Auto (default is best match based on date range)
- Daily
- Weekly
- Monthly
- Chart for Top Rejection Reasons
- Reason
- Count of (number of leads rejected for this reason) and %
- Rejected Leads By Campaign
Rejected Leads is comprised of:
- Filters
- Return count badge with number
- Grid for returned counts with the following detail for the data:
- First Name
- Last Name
- Job Title
- Company
- Phone
- Country
- Campaign
- Publisher
- Rejection date
- Rejection Reason
- Export
- Extract rejected leads data visible in the grid
- Exported data has same filters/sort order as applied on the grid
- All columns are exported
- Data formatting is maintained, except for Rejection date. Universal format visible in the grid DD MMM YYYY, whereas in the exported data the format is DD/MM/YYYY
Rejection Analytics Filters
Rejection Analytics can be filtered by Date Range, Campaign and /or Publisher (Publisher filter is for Media Buyers only). Select the filters you want to use and apply.
All date filters apply to the IsValidINQ field (Qualified or Disqualified) date for leads (not the lead created date).
Pending leads looks for any lead created within the date parameters but does not have a IsValidINQ Status yet.
Filter breakdown:
- Date Range*
- Last 7 days
- Last 30 days
- Last 90 days
- Current quarter - Depends on current date e.g.
- Today, September 9, 2026, falls in Q3 of the 2026 calendar year (July 1–September 30).
- In general, quarter breakdown for a calendar year is:
- Q1: Jan 1 - Mar 31
- Q2: Apr 1 - Jun 30
- Q3: Jul 1 - Sep 30
- Q4: Oct 1 - Dec 31
- Custom - select any From and To date
- Campaign
- List of Campaigns
- Publisher (filter visible to media buyers)
- List of publishers linked to campaigns (in Cost Per lead section)
Once filters are applied, the following is visible:
- Accepted Leads (#) - IsValidINQ = Qualified
- Tool Tip: Total number of accepted leads
- Rejected Leads (#) - IsValidINQ = Disqualified
- Tool Tip: Total number of rejected leads
- Pending Leads (#) - IsValidINQ = NULL
- Tool Tip: Total number of leads that have not yet been accepted or rejected
- Rejection Rate (%)
- Tool Tip: Percentage rate of rejected leads from accepted and rejected leads, i.e.(Rejected leads/(Accepted leads +Rejected leads)) x 100%
* What you need to know about date range
Today is excluded from all "Last N days" pre-sets (7/30/90) - these will show the last N complete days ending yesterday, not including the still-accumulating current day.
- endDate = end-of-day of yesterday (not today)
- startDate = midnight of (yesterday − (N−1) days)
- This gives exactly N complete days for 7/30/90
- Today's partial-day data is removed from the trend/comparison entirely.

Data can be compared against previous period (enable if desired).
The system will take the date range and compare stats for the same preceding period of time e.g. if you filtered data by the last 7 days, the system will compare stats against the 7 days before (excluding today) and these stats will display an increase or decrease (arrow up or down) followed by the percentage of the increase/decrease
- Graph will show current period & previous period columns
- Current period
- vivid green/red stacked columns for Volume
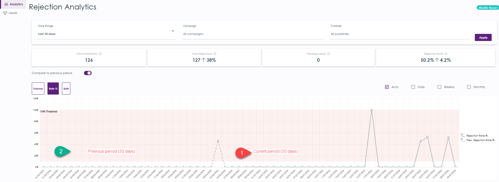
- flat trend line line with markers for Rate %
- Previous period
- lighter greed /red stacked columns for Volume
- broken trend line line with markers for Rate %
- Current period
- Rejected Leads (#, Arrow up or down and comparison %)
- Rejection Rate (%, Arrow up or down and comparison %)
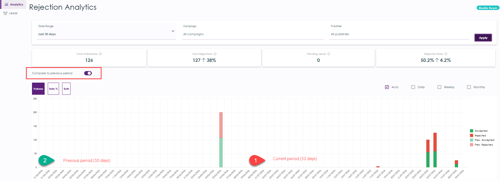
Understanding 'Compare to previous period' results in cards
First, familiarise yourself with what filters you want to compare and take a note of the values. Example below:
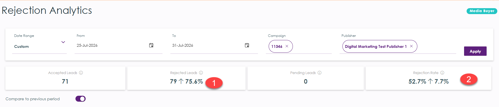

The calculation to verify result of comparison for 'Rejected Leads' is as follows (as seen in screenshots above, point 1)
=(Current Rejected Leads-Previous Rejected Leads)/Previous Rejected Leads*100
Which translates to: (79-45)/45*100 = 75.6
As this is a positive value, the card has an upward arrow in front of the percentage. The tooltip reads: More rejected leads than previous period.
If there is negative value, the card will have a downward arrow in front of the percentage. The tooltip reads: Fewer rejected leads than previous period.
The calculation to verify result of comparison for 'Rejection Rate' is as follows (as seen in screenshots above, point 2)
=Current Rejection Rate-Previous Rejection Rate
Which translates to: 52.67-45 = 7.67
As this is a positive value, the card will have an upward arrow in front of the percentage. The tooltip will read: Higher rejection rate than previous period.
If there is a negative value, the card will have a downward arrow in front of the percentage. The tooltip reads: Lower rejection rate than previous period.
Rejection Analytics: Total Leads Charts
Total Leads are both Accepted Leads (Green) and Rejected Leads (Red). Data can be displayed by different chart types:
- Volume ( % Stacked columns)
- Rate % (Line chart with markers of rejection rate %)
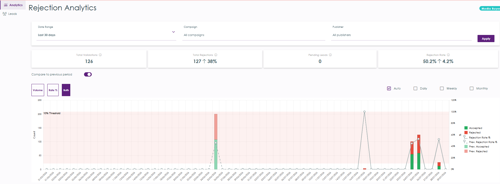
- Both
Total Leads chart can be broken down by:
- Auto (default is best match based on date range, normally last 30 days)
- Daily
- Weekly
- Monthly
If counts are also being compared against the previous period a trendline is also be visible (grey line for current period & broken line for previous period - see legend)
If both metrics is selected, the graph will display both Volume & Rate% for the previous and current period:
Rejection Analytics: Top Rejection Reasons
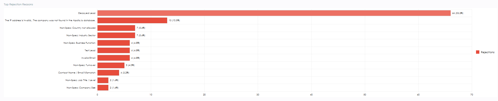
Chart for Top Rejection Reasons is a clustered bar chart, highest to lowest (up to 15 reasons)
- Reason
- Count of (number of leads rejected for this reason) and %
See count: If a top rejection reason bar is hovered over the count is visible
See detail: If clicked, user is taken to Rejected Leads page.
- Filters used visible at the top of the page (these can be changed if required)
- Notification bar identifying which rejection reason data is filtered by e.g. Filtered by rejection reason: Non-Spec: Job Title / Level
- Badge with count of rejected leads is visible and matches the bar selected in Top Rejection Reasons chart
- Grid of rejected leads is visible
- Grid is searchable
- Data in grid can be exported
- Filter can be cleared
Rejection Analytics: Campaign breakdown
Summary grid per campaign that contains:
- Campaign
- Total Submissions
- Rejected
- Rejection Rate
This grid is searchable (search applies by the campaign name)
Rejected Leads Filters
Rejected Leads can be filtered by Date Range, Campaign and /or Publisher (Publisher filter is for Media Buyers only). Select the filters you want to use and apply.
Filter breakdown:
- Date Range:
- Last 7 days
- Last 30 days
- Last 90 days
- Current quarter
- Custom - select any From and To date
- Campaign
- List of Campaigns
- Publisher (Filter visible to media buyers)
- List of publishers linked to campaigns (in Cost Per lead section)
Once filters are applied, the following is visible:
- Badge with count of rejected leads
- Grid of rejected leads
- Grid is searchable
- Data in grid with this detail for rejected leads:
- First Name
- Last Name
- Job Title
- Company
- Phone
- Country
- Campaign
- Publisher
- Rejection date
- Data in grid can be exported
- Export downloads all leads matching current filters including summary metrics
Rejected Leads: Rejection Detail
To view Rejection Detail which includes validation history for a rejected lead, click on one of the rejected leads. A split panel loads:
- On the left-hand side: Rejected Leads columns reduce to 4: First Name, Last Name, Company & Rejection Reason
- To the right: Full Name for the rejected lead is the header with 'Rejection Detail' beneath
- 3 sections visible: Contact Information, Rejection Information & Validation History
- In Contact Information section see: Full Name, Job Title, Company, Email, Phone & Country - this information will all match the record in the Rejected Leads grid
- In Rejection Information section see: Campaign, Publisher, Rejection Date & Rejection Reason - same again, this information will all match the record in the Rejected Leads grid
- In Validation History section see: Checks for validation pass for these fields: Phone, Company, IP and the validation results & timestamp
If no automated validation events exist a banner is visible: This section only shows automated validation events, such as Check Phone and Check IP.
Manually validated digital process leads will not have validation history entries.